What K9LogTracer solves

A serious K9 program produces information every day: what you trained, with which dog, what went well and what needs more work. The problem is never a lack of data. It's losing that data in notebooks, scattered spreadsheets and the memory of whoever was there that afternoon. See how it works in the videos, or take the full summary in the presentation.

Raw data, organized.

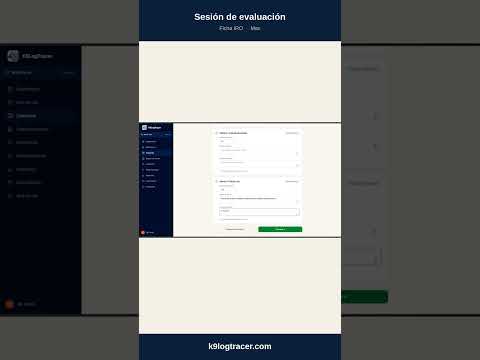
A session is more than a disconnected note. It connects a dog, a level, a set of tests and a verdict. K9LogTracer keeps every piece in place and calculates the color scale for you.

  • Whole-number scoreNo ambiguous decimals. 0 to 100, test by test.
  • Color scaleGreen ≥ 80, amber 55–79, red below. At a glance.
  • Work areasWhat to improve and what to maintain, on the same record.
  • ExportableWhatsApp, email or a signed PDF for the dog's file, with a QR anyone can verify without logging in.
Certification hierarchy
EntityIRO · FCI · FCA
CertificationRescue — RH
LevelLevel B
TestUrban trailing 800 m

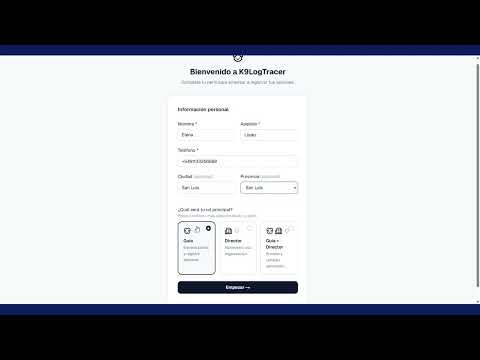
Welcome to K9LogTracer

Seven full days, no card required.

Sign in with Google or with email and password. Each organization sees only its own data: one unit's sessions, dogs and reports are inaccessible to any other, and the app's pages are closed to the public and to search engines.
Add your dogs in training

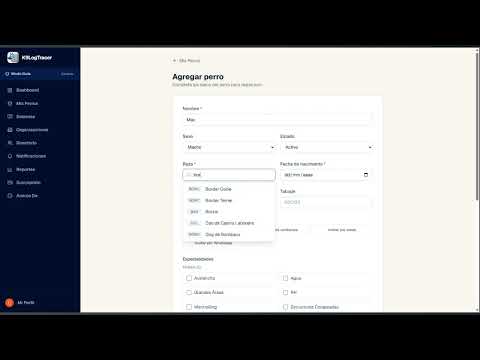
Four hundred ninety-five breeds preloaded: not one typed by hand.

Create and edit each dog with breed, age, status and specialties, with the age calculated and current certifications in view. Every dog has an assigned handler, because the record isn't the dog's alone: it's the handler–dog team's.

Sessions and Evaluations

The whole session, test by test, in minutes.

Date, dog, certification level and the tests worked on. Each test is scored separately, as a whole number against the maximum the standard defines, plus the areas to improve and the areas to maintain that separate a useful log from a list of mistakes.

Working dashboard

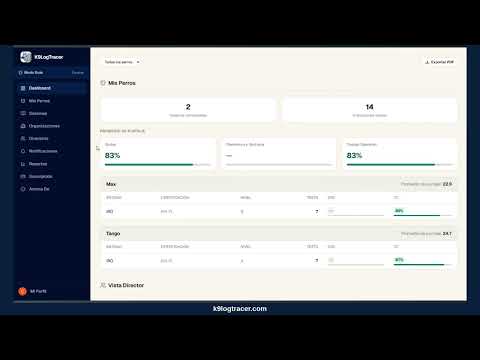
At a glance, which teams are solid and which aren't.

Per-dog average score on a color scale, grouped by Entity, Certification and Level. The director can also group by handler and compare teams on the same yardstick: hours logged, tests run and mistakes that repeat.